US Transportation Statistics
-
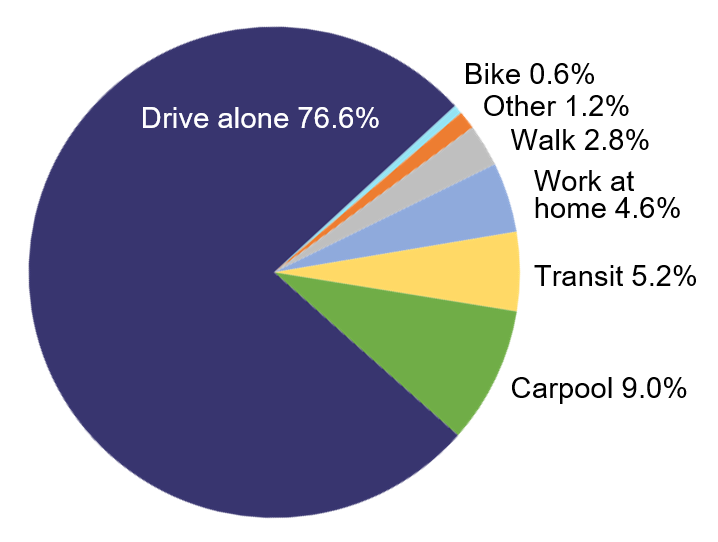
Commute Mode Share in US, 2015
(Source: Bureau of Transportation Statistics)
-
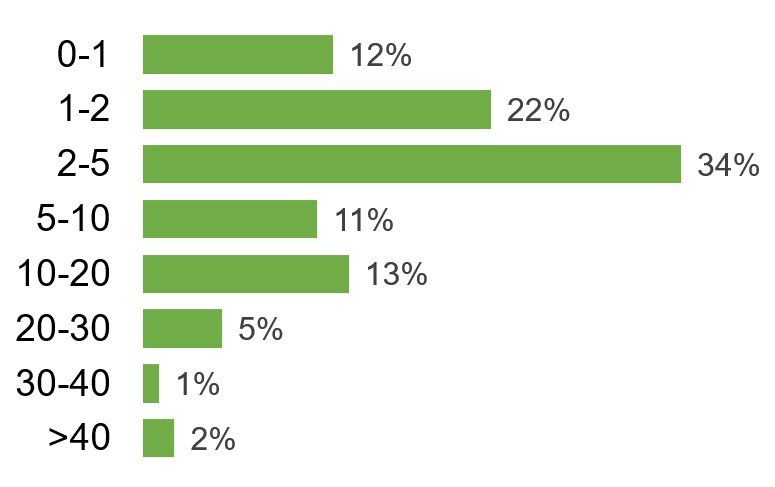
Trip Length (miles) in Petaluma
(Source: Sonoma County Transportation Authority)
-
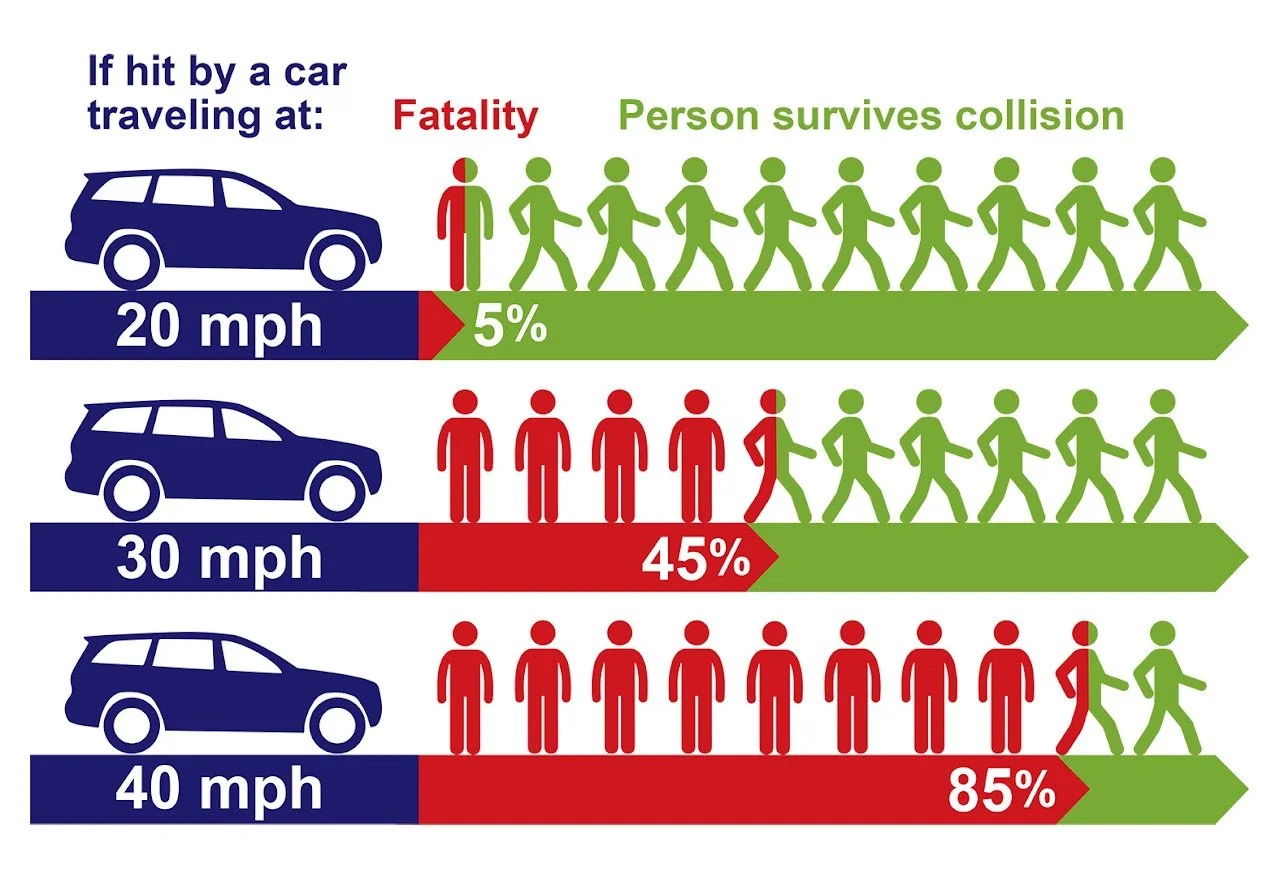
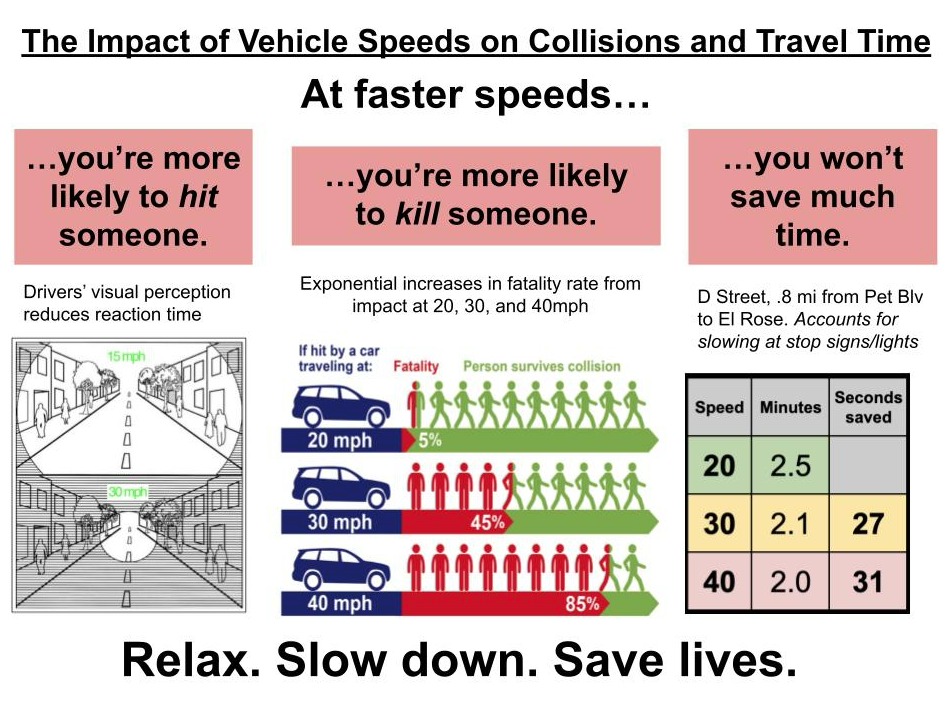
Fatality Rate by Speed
(Source: National Traffic Safety Board)
-
Speed, Reaction Time, Fatality Rate
The complete case for slowing down!
Average Annual Cost of Car Ownership
According to the American Automobile Association (AAA), the average annual cost of owning and operating a new car in the U.S. is now $9,282.00 or $773.50 a month. This cost is for vehicles driven 15,000 miles a year in 2022 and includes depreciation, loan interest, fuel, insurance, maintenance, and miscellaneous fees.
CA Person-Miles of Private Vehicle Travel
(Source: U.S. Department of Transportation)
27,970 average annual miles are driven by a person in private vehicles, including cars, vans, sport utility vehicles, pickup tricks, taxicabs, other trucks, recreational vehicles, motorcycles, and light electric vehicles such as golf carts.
The Four Types of Cyclists
According to research into attitudes toward cycling conducted by Jennifer Dill, PhD (and colleagues) in 50 U.S. cities , there are Four Types of Cyclists:
7% "Strong and Fearless"
5% "Enthused and Confident"
51% "Interested but Concerned" (These are the folks who say they would ride a bicycle, but they don't feel safe doing so. This 51% of our community needs Class 1 bike paths and Class 4 bike lanes in order to feel comfortable riding a bicycle)
37% "No Way, No How"
More Statistics